Inworld Agent Runtime adds a new category Inworld Graph to the Unreal Engine Gameplay Debugger system. See the official Unreal documentation: Using the Gameplay Debugger in Unreal Engine.Documentation Index
Fetch the complete documentation index at: https://dev.docs.inworld.ai/llms.txt
Use this file to discover all available pages before exploring further.
Launch the Gameplay Debugger
- Press the apostrophe key
"to toggle the Gameplay Debugger. This is the Unreal Engine default and can be changed in your input settings.
What it shows
This debugger mirrors much of the information you can access via Portal (see Portal Traces), but it links directly to the actors running the graphs so you can visually inspect what is happening in real time within your game. You can inspect executions on a per-actor/object basis as they run.Views
Startup state
When you first open the debugger, depending on the map you’re running, there may be no graph executions yet. In that case, you’ll see an empty state like this: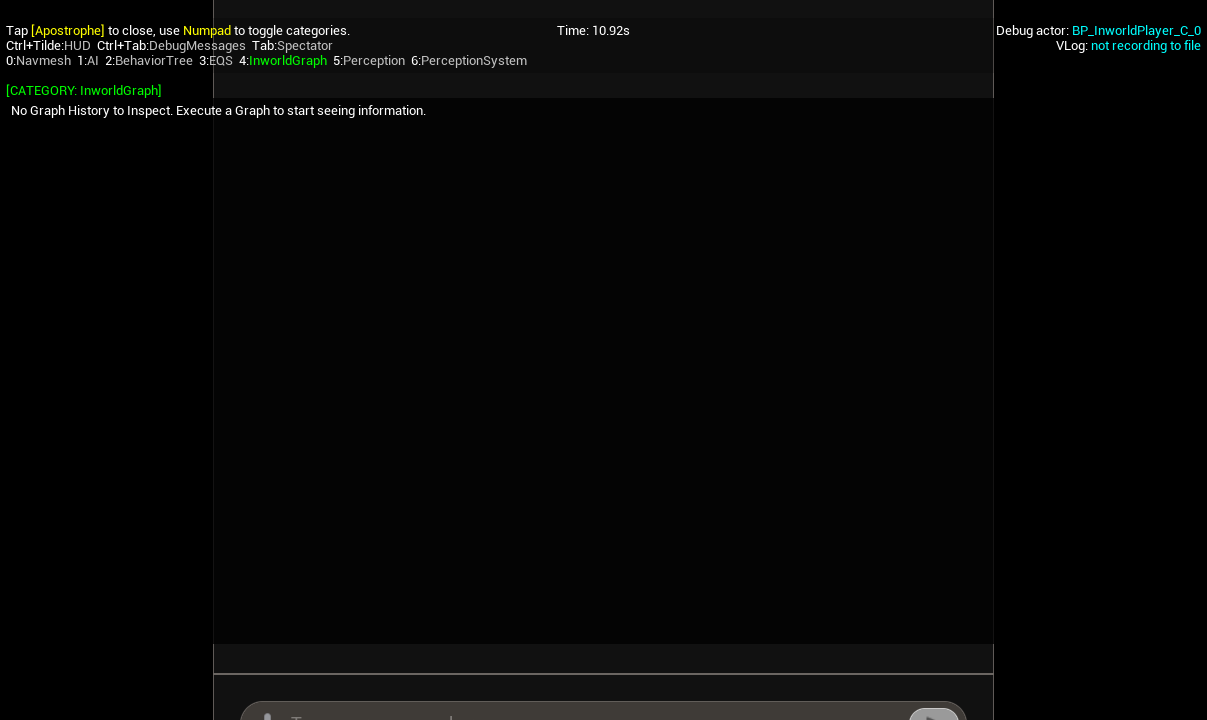
Live execution updates
When a graph starts running, the debugger immediately updates with the execution steps of the graph: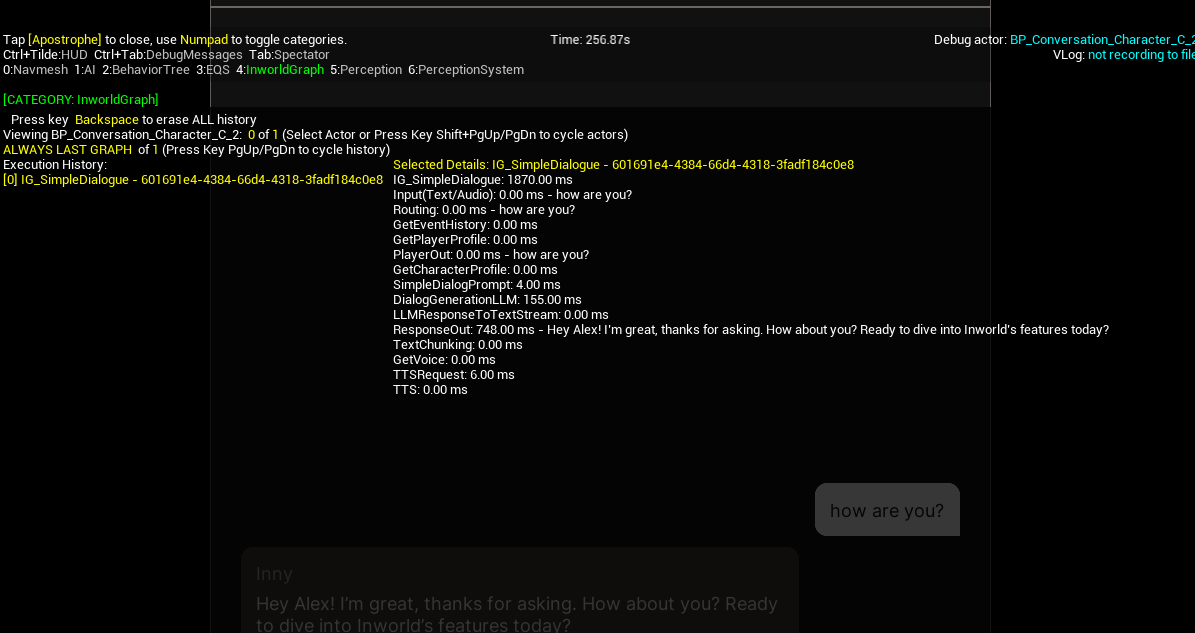
Inworld Graph category layout
Graph executions are listed in the left column (chronological, oldest to newest). Details for the selected execution appear in the right column: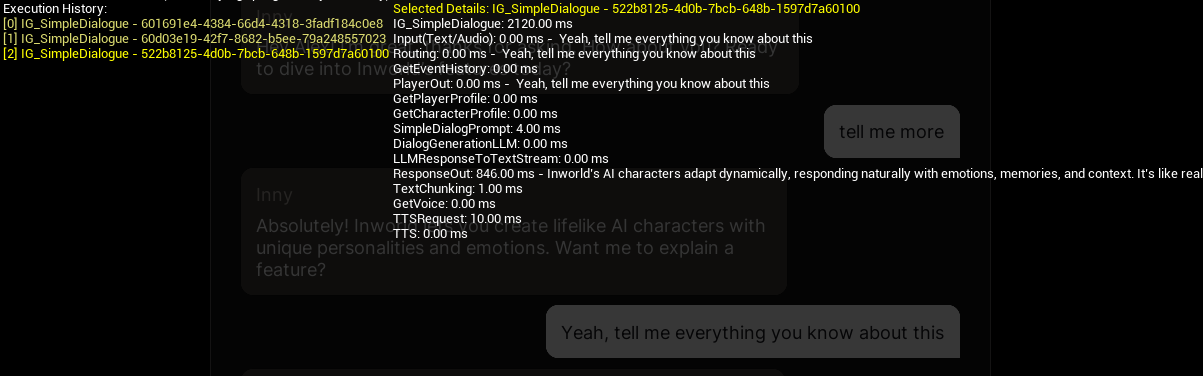
Controls
- Switch actor: Shift + Page Up or Shift + Page Down
- Switch execution history: Page Up or Page Down
- Clear all history: Backspace
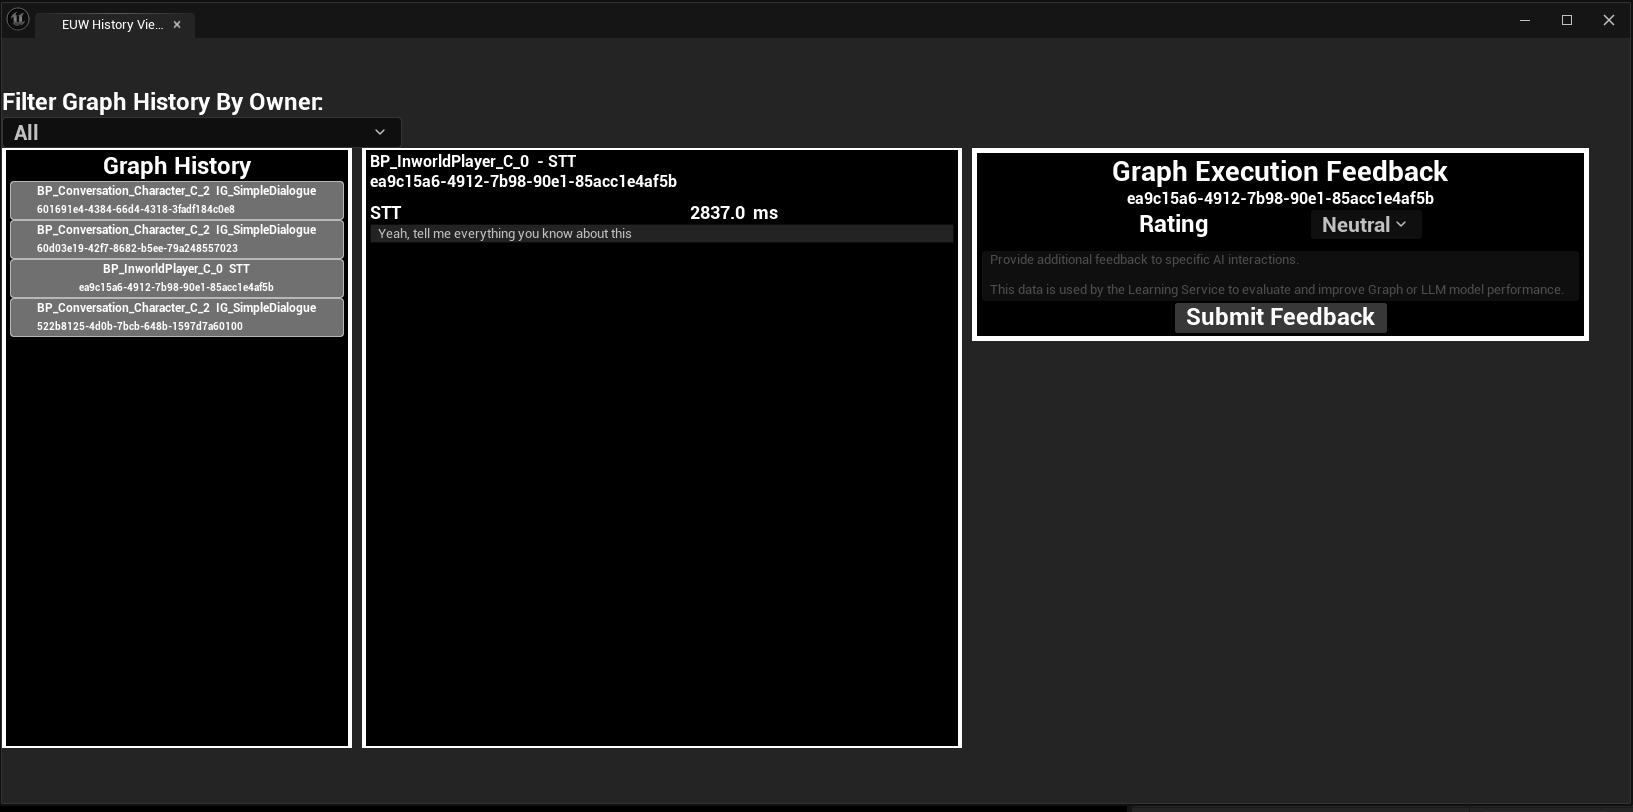
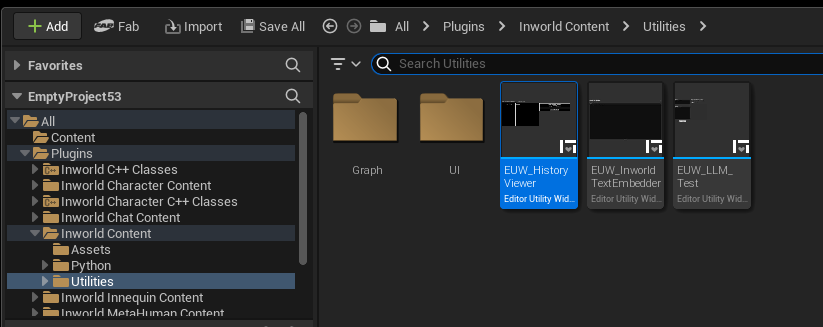
Editor utility widget
If you’re running in the editor, use the Editor Utility Widget EUW_HistoryViewer to browse and inspect graph executions.- Open via Content Browser:
/Plugins/Inworld Content/Utilities
- Left panel: Select an execution history.
- Middle panel: View the node execution history for the selected graph.
- Right panel: Send feedback to Portal for the selected execution to support controlled evolution workflows.