Metrics are quantitative measurements that provide insights into your application’s performance, user behavior, and business outcomes. They serve as the foundation for data-driven decision making and continuous improvement.
- Default metrics are automatically collected for all graphs during execution
- Custom metrics are user-defined measurements that you can create to track specific behaviors or KPIs relevant to your use case
All metrics can then be visualized in dashboards on Portal.
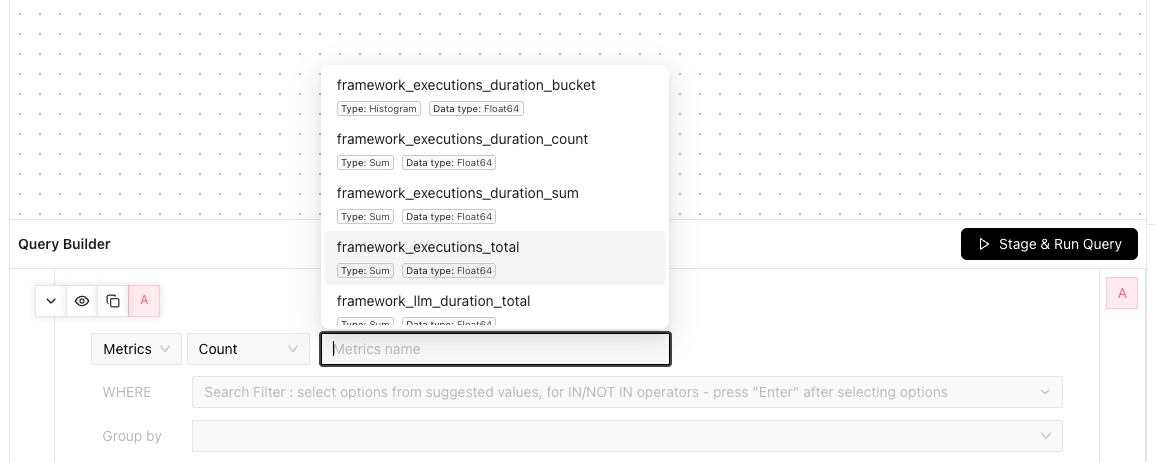
Metric Dropdown: Metrics appear in the dropdown only after being recorded. If you don’t see any metrics in the dropdown, execute your graph to generate data. You can also enter metric names manually in the selector.
Metric Types
Runtime supports the following types of metrics, with the option to use either integer or double precision:
- Counters - Track cumulative values that only increase (e.g., total interactions, errors)
MetricType.COUNTER_UINT      // Integer counter
MetricType.COUNTER_DOUBLE    // Double counter
- Gauges - Track current values that can go up or down (e.g., active users, response latency)
MetricType.GAUGE_INT         // Integer gauge
MetricType.GAUGE_DOUBLE      // Double gauge
- Histograms - Track value distributions over time with automatic percentile calculations (e.g., response time percentiles)
MetricType.HISTOGRAM_UINT    // Integer histogram
MetricType.HISTOGRAM_DOUBLE  // Double histogram
Default Metrics
These metrics are automatically calculated when you execute your graphs.
| Metric | Metric Type | What it Shows |
|---|
framework_executions_duration | Histogram | Distribution of graph execution duration / latency |
framework_executions_total | Counter | Count of graph executions |
framework_llm_duration_total | Counter | Total LLM execution duration |
framework_llm_generation_tokens_total | Counter | Number of LLM output tokens per unit of time |
framework_llm_prompt_tokens_total | Counter | Number of LLM input/prompt tokens per unit of time |
framework_time_to_first_token | Histogram | Distribution of latency for time to first token across all LLM node executions |
Histogram metrics appear as 3 separate metrics in the metric dropdown selector:
_bucket (distribution)_count (total observations)_sum (sum of values)
Custom Metrics
Custom metrics complement the default metrics to give you a complete picture of your application’s performance. These can include:
- Engagement KPIs (e.g., session length, retention rates)
- Business metrics (e.g., in-app purchases, subscription revenue, model costs)
- User feedback tracking (e.g., thumbs up/down)
To create a custom metric:
Initialize telemetry
import { telemetry } from '@inworld/runtime';

telemetry.init({
  apiKey: 'your-inworld-api-key',
  appName: 'MyApp',
  appVersion: '1.0.0'
});
Configure metrics
import { MetricType } from '@inworld/runtime/telemetry';

// Configure metrics once at startup
telemetry.configureMetric({
  metricType: MetricType.COUNTER_UINT,
  name: 'user_interactions_total',
  description: 'Total user interactions',
  unit: 'interactions'
});

telemetry.configureMetric({
  metricType: MetricType.HISTOGRAM_DOUBLE,
  name: 'response_time_seconds',
  description: 'Response time distribution',
  unit: 'seconds'
});
Record metrics
// Track user interactions
telemetry.metric.recordCounterUInt('user_interactions_total', 1, {
  userId: 'user123',
  feature: 'chat'
});

// Track response times
telemetry.metric.recordHistogramDouble('response_time_seconds', 0.245, {
  endpoint: '/chat',
  model: 'llm-1'
});
Using Metrics with Experiments
When running experiments, it’s important to track metrics to understand how different variants impact key metrics like latency or engagement. Metrics can be tracked with attributes that identify which experiment and variant they are associated with.
Below is an example demonstrating how to execute a graph with user context and log relevant metrics along with the user context:
import { telemetry } from '@inworld/runtime';
import { MetricType } from '@inworld/runtime/telemetry';
import { GraphBuilder, UserContext } from '@inworld/runtime/graph';

// Initialize telemetry and configure metrics
telemetry.init({
  apiKey: process.env.INWORLD_API_KEY, // replace with your API key
  appName: 'ChatApp',
  appVersion: '1.0.0'
});

// Configure metrics
telemetry.configureMetric({
  metricType: MetricType.COUNTER_UINT,
  name: 'chat_interactions_total',
  description: 'Total chat interactions',
  unit: 'interactions'
});

telemetry.configureMetric({
  metricType: MetricType.HISTOGRAM_DOUBLE,
  name: 'response_latency_seconds',
  description: 'Response time distribution',
  unit: 'seconds'
});

// Execute graph with user context and metrics
async function handleUserMessage(userId: string, message: string) {
  const startTime = performance.now();

  // Create user context with targeting information
  const userContext = new UserContext({
    userId: userId,
    userTier: 'premium',
    region: 'us-west'
  }, userId); // targetingKey

  try {
    // Create graph using GraphBuilder
    const myGraph = new GraphBuilder({
      id: 'chat-graph',
      apiKey: process.env.INWORLD_API_KEY,
      enableRemoteConfig: false,
    })
      // Add your nodes and edges here
      .build();

    const outputStream = myGraph.start({ text: message }, userContext);

    // Process the response
    for await (const result of outputStream) {
      // Handle graph output here
    }

    // Record success metrics
    const latency = (performance.now() - startTime) / 1000;

    telemetry.metric.recordCounterUInt('chat_interactions_total', 1, {
      userId: userId,
      userTier: userContext.attributes.userTier,
      status: 'success'
    });

    telemetry.metric.recordHistogramDouble('response_latency_seconds', latency, {
      userTier: userContext.attributes.userTier,
      messageLength: message.length.toString()
    });

  } catch (error) {
    // Record error metrics
    const latency = (performance.now() - startTime) / 1000;

    telemetry.metric.recordCounterUInt('chat_interactions_total', 1, {
      userId: userId,
      userTier: userContext.attributes.userTier,
      status: 'error',
      errorType: error.name
    });

    telemetry.metric.recordHistogramDouble('response_latency_seconds', latency, {
      userTier: userContext.attributes.userTier,
      status: 'error'
    });

    throw error;
  }
}
- Pass user context: UserContext provides targeting information for graph execution
- Track performance by user segments: Use user attributes (tier, region) in metric tags
- Measure real latency: Track actual response times under real conditions
- Monitor errors: Record both success and failure metrics with context
Next Steps